Journalist Resource
 April 17, 2024
How We Used Open Data To Report on Coastal Consequences of Climate Change in Uruguay
Country:


This project will look at three vulnerable groups of workers: domestic workers, commuters, and...
Haz clic aquí para leer este artículo en español.
From Drought to Floods: The Impact on Work in the Coastal Zones of Uruguay, From East to West is the most ambitious work we have done at Amenaza Roboto, a science and technology journalism website based in Montevideo, Uruguay.
At Amenaza Roboto we view journalism as a service: We believe it should more effectively inform the needs of local communities, and that smaller newsrooms in the Global South can address issues that are often overlooked. For this reason, we created the only climate data vertical that exists in our country.
Thanks to the funding and support of the Pulitzer Center, Amenaza Roboto was able to focus on how climate change could reconfigure the lives of workers in Uruguay.

As a nonprofit journalism organization, we depend on your support to fund more than 170 reporting projects every year on critical global and local issues. Donate any amount today to become a Pulitzer Center Champion and receive exclusive benefits!
For six months, we analyzed open databases from the national government related to climate, socioeconomic, and geographic issues, and studied satellite data to obtain information on the impact of climate on population and employment. We focused on three vulnerable groups: domestic workers, commuters, and artisanal fishermen. We also generated a database using photogrammetry and lidar technology that was integrated with open government data through 3D visualizations.
In our research, we studied communities located in three areas (Montevideo, Ciudad del Plata, and Valizas) where climate change will most likely affect working conditions and occupational safety. We described how climate change and climate variability are already impacting the lives of workers in Uruguay and are expected to further impact impoverished populations. We also established, from early reporting, that data can help us address these challenges. By leveraging open data, as a society, we have the ability to make decisions and take crucial action before people in Uruguay are negatively affected by projected floods and other natural disasters.
From Drought to Floods is made up of three stories, each edited in Spanish, Portuguese, and English:
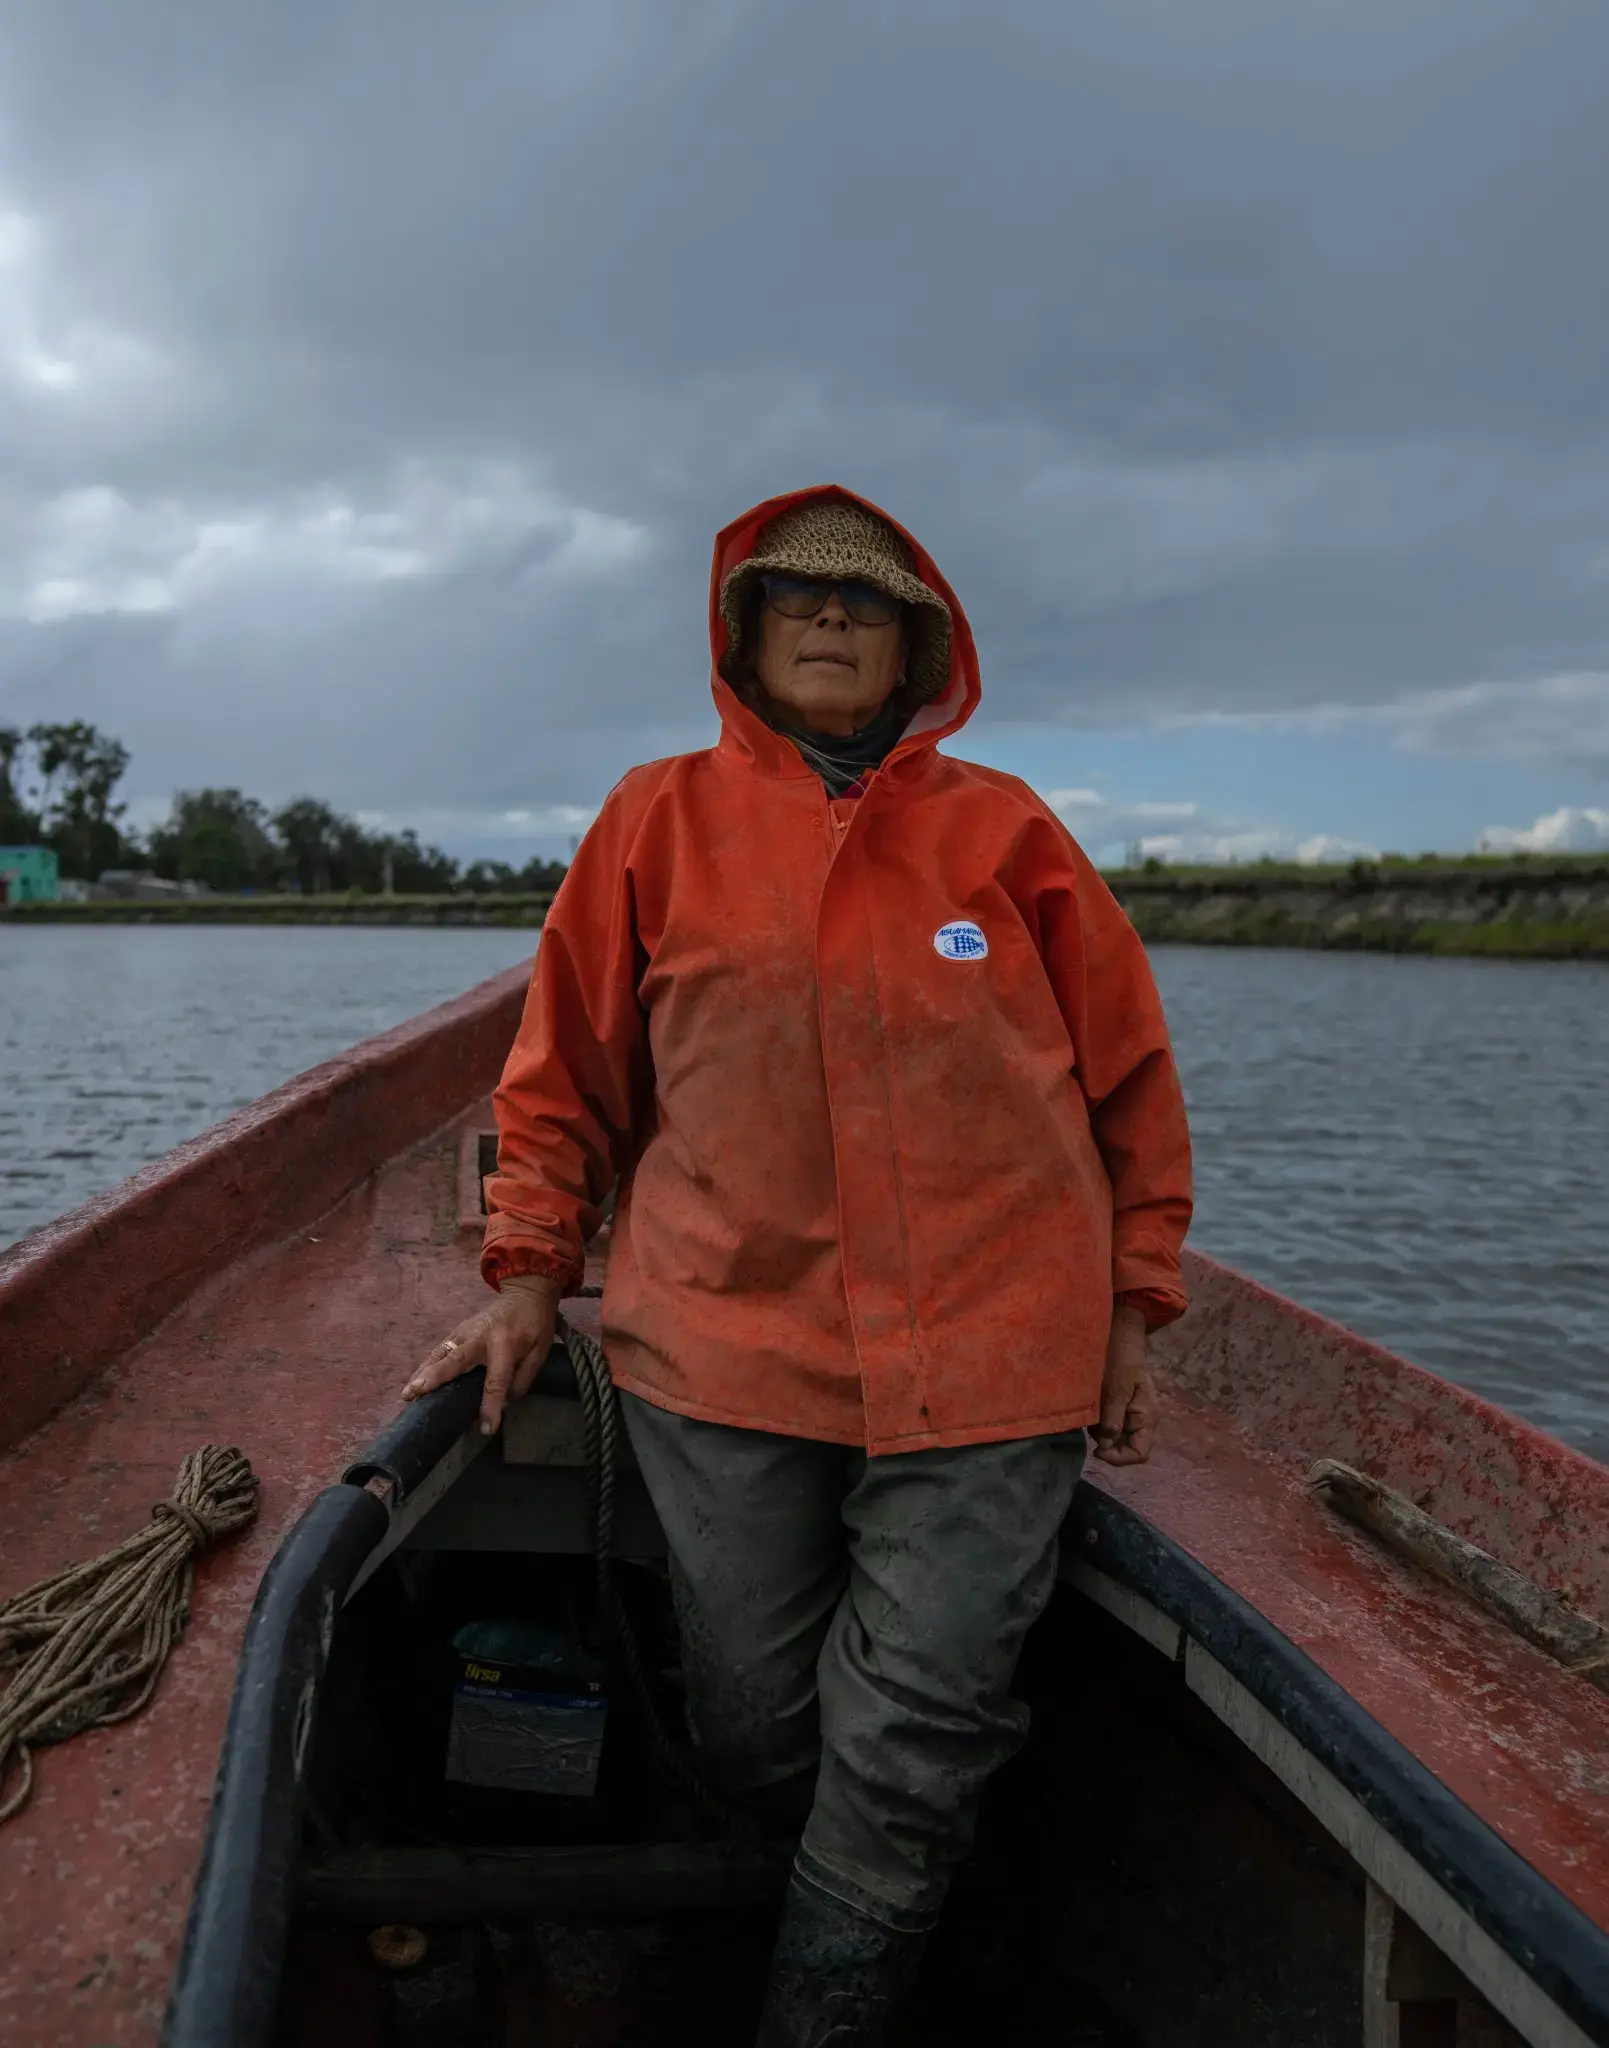
- "Quicksand"
Artisanal fishermen in the Valizas area work in the ecosystem of coastal lagoons to supply shrimp to tourism, gastronomy, and commerce. Unusually wet weather disrupted stream and ocean flows, with some catastrophic effects on the regular shrimp harvest.
- "Climate Change, Mobility and Inequality"
Some of the consequences of climate change for domestic workers are expected to be life-changing. They would spend more time traveling between home and work, and many reside in what will be flood-prone areas of the city.
- "Commuter Town"
A large part of the population of Ciudad del Plata will be affected by floods projected by the Ministry of the Environment due to climate change. Amenaza Roboto used the latest technology available to visualize the impact on the population and ecosystems with the greatest precision possible.
From Idea to Research
I) Testing to define where to investigate and what kinds of stories we could tell
This project built upon the findings from The Submerged City, a previous research project by Amenaza Roboto that won a Sigma Award in 2023.
For the first time in Uruguay, we created a team of journalists and scientists to analyze data on the flood line and its impact on the population and relevant infrastructure on the coast of Montevideo.
To understand the differences in the impact of floods due to the variables of gender, age, access to services, and to provide tools that allow us to understand how they influence inequality in the population, we studied areas with populations from different socioeconomic levels: the area that covers Pajas Blancas, Cerro, and La Teja, La Aguada, Carrasco, and Santiago Vázquez.
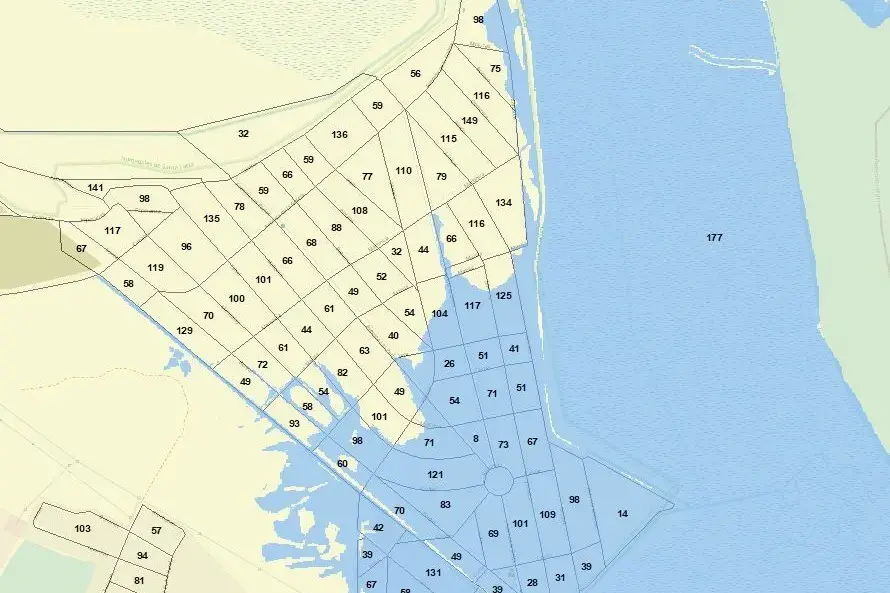
We conducted simple geoprocessing using the Geographic Information System, the database of the 2011 Population Census, and flood line information published by the Ministry of the Environment, modeled for the most extreme climate scenario (E10, TR500*).

Through this we obtained a set of maps that projected the flood surface, population data by age and gender, and infrastructure by census segment. Two types of impact emerged from this cartographic representation: direct, where all infrastructure would be invaded by water; and indirect, where the water would partially surround the structures and census areas.
We executed this same methodology in the departments of Rocha (where Puente de Valizas, Valizas, and Barra de Valizas are); San José (where Ciudad del Plata is); and in new areas of Montevideo. As a consequence of this, we ruled out other towns in the department of Rocha, such as La Paloma and Punta del Diablo (where we initially planned to investigate).
We were able to adjust our hypotheses about mobility and inequality in Montevideo, and we had to rethink the story we had to tell in Ciudad del Plata.
At the beginning of the process, we wanted to focus on how the floods and flood projections were going to affect educators there, but, as you can ultimately see in “Commuter Town,” the data led us to tell a story in which the entire city would be affected.


II) Reading and analysis of 19 national and international documentary sources
Our research is rooted in scientific research and official publications from different entities of the Uruguayan government and international organizations, as well as consultations with organizations such as the Social Insurance Bank (BPS), the Ministry of Environment, Agencia de Gobierno Electrónico y Sociedad de la Información y del Conocimiento (AGESIC), University of the Republic (UDELAR), Catholic University of Uruguay (UCU), and National Directorate for Aquatic Resources (DINARA).
III) Field trip and interviews
We started in Puente de Valizas, home to the country’s artisanal shrimp fisherfolk. We interviewed local workers, and with photos and drone video captured the effects of the extreme drought that Uruguay was experiencing.

Once we decided on the protagonists of the story, we interviewed them multiple times over several months. In addition, we interviewed and consulted scientists from the Atlantic fisheries management unit of the National Directorate for Aquatic Resources.
In Montevideo, we interviewed the president of the domestic worker's union, Sindicato Único de Trabajadoras Domésticas, and her colleagues who reside in areas prone to flooding.

We also interviewed urban planners and sociologists who specialize in mobility, inequality, and gender.
In Ciudad del Plata we interviewed teachers from different generations who reside or work in the area, and workers from the local industrial plants. We also interviewed a researcher from the Faculty of Architecture (UDELAR) and the researcher responsible for the hydraulic works course at the Faculty of Engineering (UDELAR) to understand more about dams and infrastructure development.
IV) Data analysis
We used 21 open data sets from the Uruguayan government:
- National Directorate of Topography
- Ministry of Interior
- National Statistics Institute
- Montevideo Municipality
- San José Municipality
- Ministry of Environment - National Environmental Observatory
- Ministry of Social Development
- Institute for Children and Adolescents of Uruguay
- National Public Education Administration
B. We used three open data sets that we generated in our research:
- Name: Basurero (Trash Can)
Description: Points that represent landfills in Delta del Tigre, San José.
Source: Amenaza Roboto
Coordinate Reference System (CRS): WGS 84, UTM projection 21S
- Name: Industria (Industry)
Description: Points that represent industries in Delta del Tigre, San José.
Source: Amenaza Roboto
Coordinate Reference System (CRS): WGS 84, UTM projection 21S
- Name: Barriostrabajoempleadas (Neighborhoodsworkemployees)
Description: Points. Domestic workers by neighborhood.
Source: Amenaza Roboto
Coordinate Reference System (CRS): WGS 84, UTM projection 21S
V) Data processing and visualization
- Satellite images from Google and Planet Labs
Each story required different techniques to be told effectively.
In the case of artisanal fishermen, we worked with satellite images from Google and Planet. This allowed us to show readers the reality of Laguna de Castillos, the place where shrimp grow, and how the unusual phenomenon of 2023 ended up having an extreme impact on the shrimp harvest.
- Mapbox
We used Mapbox to show the historical neighborhoods of Montevideo, where the majority of domestic workers live, the flood projections, and the bus lines that will be affected by water.
This was the first time that Mapbox was used to reflect climate change in Uruguay.

- Maps
Just like in The Submerged City, we create our maps and the shapefiles, all of which can be accessed through the Amenaza Roboto Github account.

- Lidar
Lidar (Light Detection and Ranging) is a remote sensing technology that uses pulses of laser light to measure the distance between a light emitter and an object on the Earth's surface. This technique is based on measuring the time it takes for light to bounce off the object and return to the receiver. Reflections are recorded as millions of individual points, collectively called a "point cloud," that represent the three-dimensional positions of objects on the surface.
Flood mapping and simulation largely depend on the accuracy of available Digital Elevation Models (DEM). A Digital Elevation Model is a visual and mathematical representation of the heights of the terrain in relation to the mean sea level, which facilitates the characterization of the relief forms and the elements present. Surface models obtained from lidar systems allow obtaining an accurate projection of what will happen on the ground surface given certain climate scenarios.

A lidar sensor that is mounted on platforms such as drones or airplanes is known as airborne lidar. For our project, we simulated the water level and its lateral variations in 3D with the objective of visualizing the effect of sea level rise under climatic scenarios (E10 TR500) in two urban areas of Uruguay: Penino and Delta del Tigre. To this end, our team carried out airborne lidar surveys by drone over an area of more than 75 hectares, which were used to develop high-resolution DEMs and Surface Models, and 2D and 3D visualizations from point clouds. The DEMs were compared with the existing ones from IDEuy, and the cartographic data generated by the Military Geographic Institute of Uruguay. The E10 TR500 flood layer prepared by the Ministry of the Environment of Uruguay and 3m pixel resolution satellite images from Planet and Google Earth were incorporated into the 3D model. To simulate the increase in base sea level, the elevations affected by the flood curves (NAP costas, 2019) were compared with the topography generated from the lidar surveys. Likewise, we integrated the most recent population data at the time (INE, 2011) and landmarks such as education, health, and industrial centers.
We made several flights with lidar in Ciudad del Plata. We integrated technology with open government data through 3D visualizations, allowing us to show precisely where and to what height the water will affect homes, businesses, educational centers, and industry in this town of San José.
In our GitHub account, we have made the lidar data and raw files publicly available. The work was carried out during April and May 2023. The sensor used was the Riegl miniVUX-2 UAV lidar mounted on a MATRICE 300 drone. The flight specifications were as follows:
- Flight altitude: 70m
- Wind speed: 5 km/h on average
- Flight speed: 8m/s
- Side overlap: 70%

These efforts led us to obtain first prize in the Data Visualization Contest, organized by the World Bank and the Global Partnership for Sustainable Development Data at the Data Festival 2023.

VI) New photo sessions
As the stories progressed, we realized that we needed a new series of photos that would give us better context and that could also illustrate particularities of the place and the workers.


VII) Writing, editing and translation
VIII) Design
IX) We publish
Learnings and final reflections
At Amenaza Roboto, we would not be able to do data and climate change research without the strong public policy on open data that the Uruguayan state has had for more than a decade.
We also couldn't pursue work such as From Drought to Floods without collaborating with an interdisciplinary and diverse team that includes scientists. Key to our collaboration was establishing common objectives with them, defining roles and responsibilities, and generating instances of dialogue and camaraderie, since our disciplines move at a different pace and we must move forward in alignment.
It is important to acknowledge the skills and knowledge that each team member offers: Journalists must respect scientific rigor, while scientists must appreciate the ability of journalists to communicate effectively to a broad audience.